Quickstart Guide
The user-friendly Khiops Python library provides a unique Auto-ML solution. Khiops offers significant practical advantages, based on an original formalism:
- Advanced Automation
- Model Interpretability
- Outstanding Scalability
Auto-ML as Simple as a Regular Classifier
The Khiops Python library allows users to set-up Auto-ML pipelines which automate supervised Machine Learning, e.g. for classifying input examples into predefined groups, each identified by a label. Common applications include predicting customer churn (Yes or No), the severity of a failure (Minor, Major, Critical) etc.
Featuring unique learning algorithms, Khiops automates many steps seamlessly for the user. For example, there's no longer any need to prepare training data, as missing values, noise, outliers and unbalanced classes are handled for you. Encoding categorical variables is also no longer a problem.
Ultimately, all you need to do is use the standard Scikit-Learn syntax, and Khiops takes care of handling poor-quality raw data, producing competitive, robust and interpretable models.
🔧 Setup
# Straightforward installation using conda.
#!conda install -c khiops khiops # On Windows
#!conda install -c conda-forge -c khiops khiops # On Linux and macOS
# Import relevant packages
import pandas as pd

from khiops.sklearn import KhiopsClassifier
from sklearn.model_selection import train_test_split
📊 Load Sample Dataset
# Load and read the data file into a Pandas DataFrame
url = "https://raw.githubusercontent.com/KhiopsML/khiops-samples/main/Adult/Adult.txt"
df = pd.read_csv(url, delimiter='\t',index_col="Label")
# Extract the "class" column to create the target labels y (useful for performance analysis of the models)
y = df["class"].map({'less': 0, 'more': 1})
# Randomly split data into training and testing sets
X_train, X_test, y_train, y_test = train_test_split(X, y)
🚀 Just fit it
# Declare Khiops Auto-ML classifier object and fit it to the training dataset
clf = KhiopsClassifier()
clf.fit(X_train, y_train)
🔮 Predict
Auto Feature Engineering as Simple as Creating a Dictionary
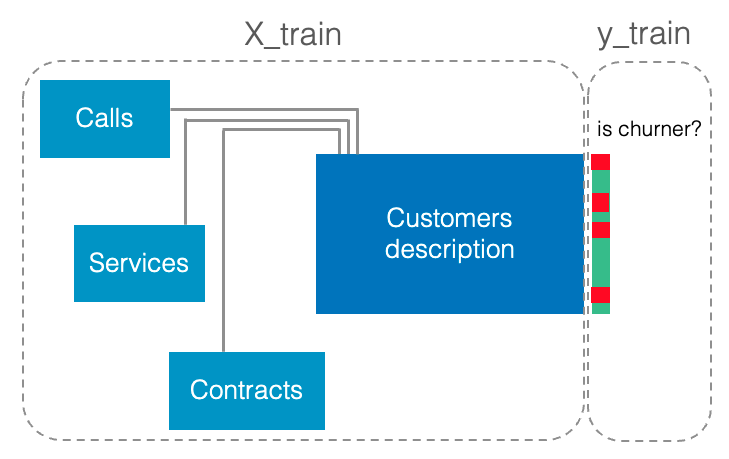
Feature Engineering aims to build a training dataset from multi-table data, by summarizing useful information from the secondary tables. For example, let's consider multi-table data where the root table describes the customers of a telecommunications operator (with one record per customer) and the secondary tables each describe call details, services used, contracts (with a varying number of records per customer). In this case, the ''call rate to foreign countries'' could be a useful aggregate for predicting customer churn.
In practice, when undertaken manually, Feature Engineering is an extremely time-consuming task which is not efficient and risks over-fitting (i.e. when using over-complex aggregates). Just feed multi-table data into the Khiops Auto-ML solution to trigger an ultra-efficient automatic Feature Engineering algorithm. All you need to do is describe the structure of the input multi-table data with a dictionary.
🖋️ Simply Describe Your Multi-Table Data
Below, we show the relevant syntax for describing multi-table data.
We continue with the previous example, where the multi-table data describes the customers of a telecommunications operator and where the goal is to predict customer churn:
Khiops allows users to describe multi-table data as a Python dictionary (a running sample is available here). Here's an example:
X_train = {
    "main_table": "Customer",
    "tables": {
        "Customer": (customer_main_df, "CustomerId"),
        "Call": (call_df, ["CustomerId", "CallId"]),
        "Service": (service_df, ["CustomerId", "ServiceId"]),
        "Contract": (contract_df, ["CustomerId", "ContractId"]),
    },
    "relations": [
        ("Customer", "Call"),
        ("Customer", "Service"),
        ("Customer", "Contract"),
    ],
}
This dictionary includes three attributes:
main_tableindicating the name of the main table,tablesdescribing all tables,relationsspecifying the links between tables.
tables is itself a dictionary, composed of one record per table. For each record, the key corresponds to the table name and the value is a tuple associating a Pandas Dataframe and a list of keys (first the main key, then the secondary keys). And relations is a list of tuples, which contain pairs of names of the linked tables (one pair per link).
🚀 Just Fit It ... as Usual
Once you have described the multi-table input data, no further effort is required.
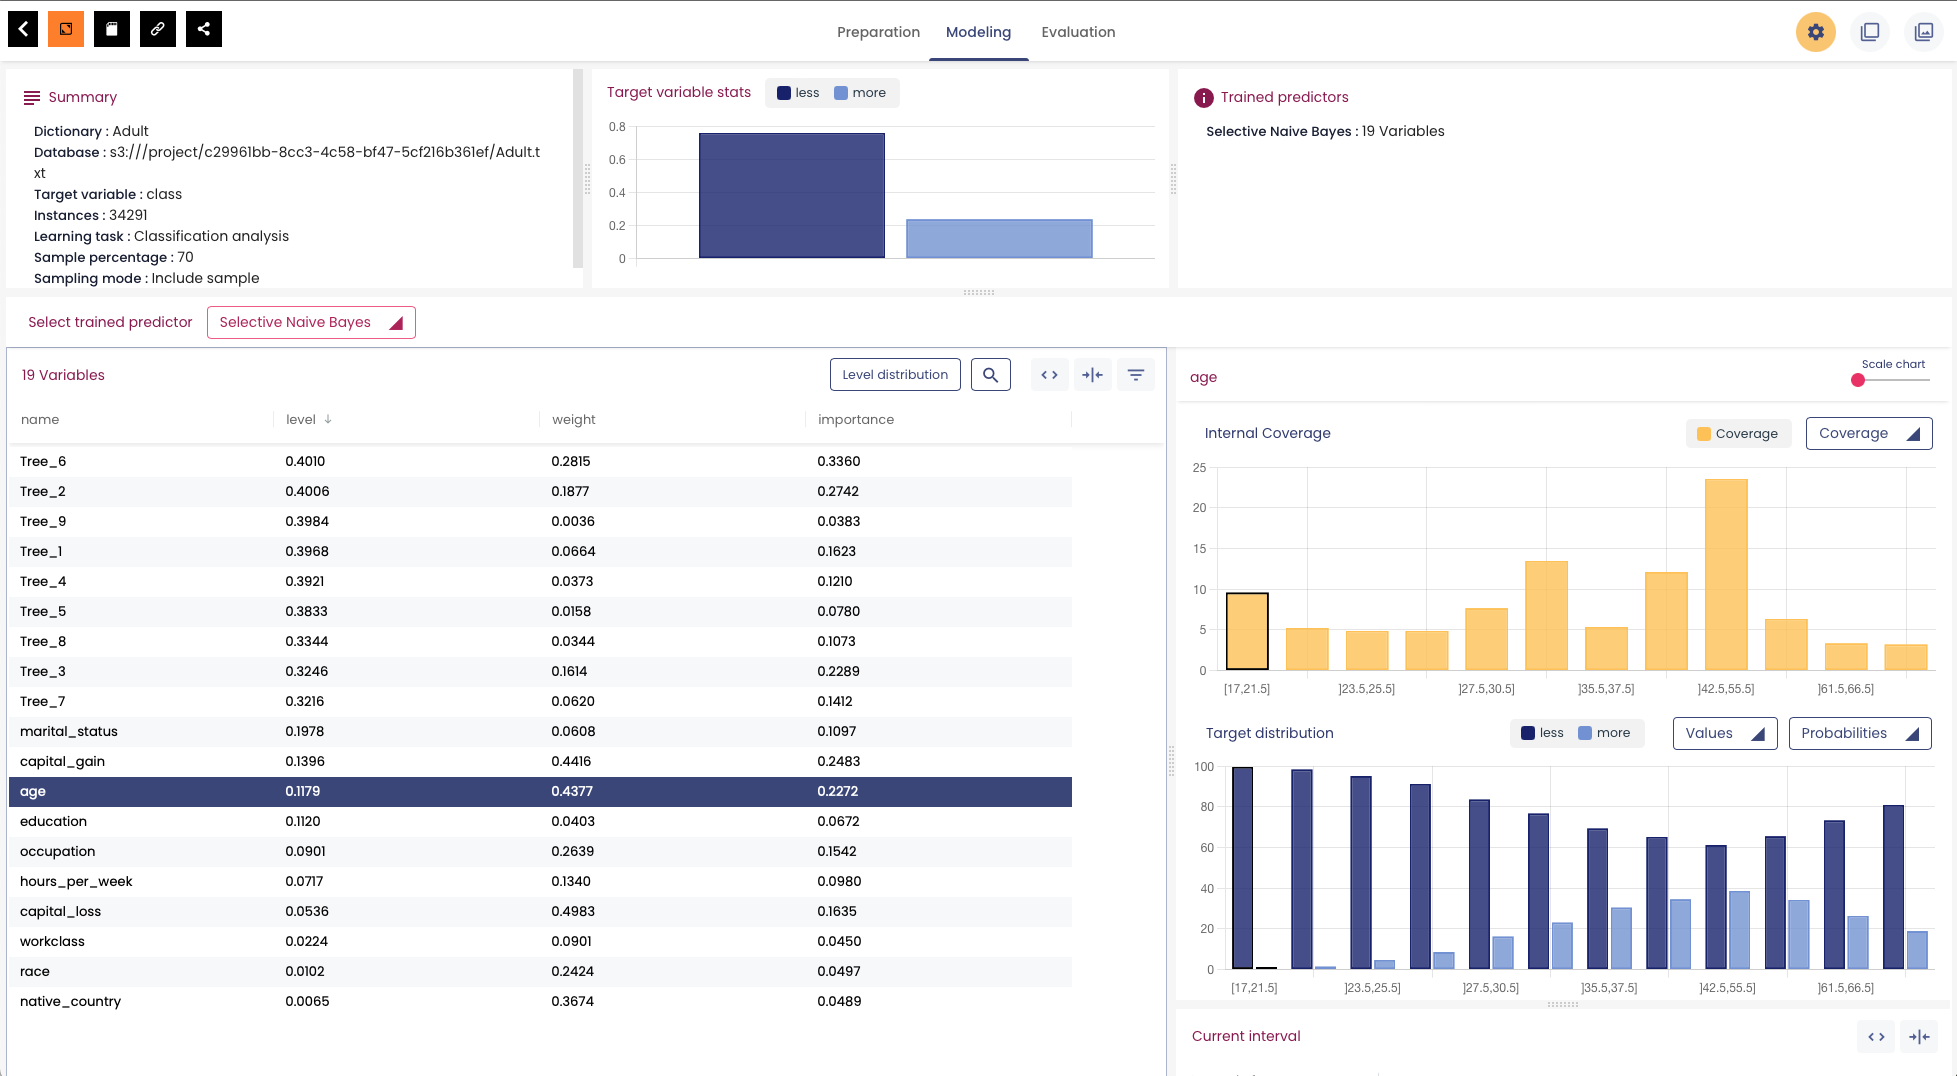
Visualizing the Analysis Reports
The analysis report contains details on the features obtained by the Khiops Auto Feature Engineering algorithm, the encoding of variables, the selection of variables and their importance for predictions.
You can open and visualize the report using the standalone Khiops visualization desktop application on several operating systems. More details on this visualization desktop application can be found on the dedicated page.
To generate the analysis report, you need to specify the output_dir parameter when creating the KhiopsClassifier estimator object instance:
# Declare the classifier with a specifed output directory and train it
clf = KhiopsClassifier(output_dir="User/Documents/test_khiops")
clf.fit(X_train, y_train)
Open the AllReports.khj file on the visualization desktop application: